tcpshark - process-aware tcpdump
As a cyber defender and a DFIR analyst, network packet captures are one of my best friends. I know that’s probably one of the most depressing things you’ve ever heard, but that doesn’t make it less true (͠≖ ͜ʖ͠≖)
Packets don’t lie if they’re stored properly, and they paint a good picture of what happened if there’s enough metadata surrounding it. If you have proper packet processing, you’ve got a powerful asset in your IR and 0-day detection toolkit. When you’re performing Cyber Incident Response on a host or a container, it’s always a good idea to turn on a packet capture in the background while you’re responding, recovering or even remediating, since more often than not those packets will come handy as evidence.
Depending on what OS you’re working with at the time, you use a different tool for capturing packets, and that tool, and the way its built, actually matters. If you want to see an example of that, look at how bash is linked against readline.so, meaning each command that you pass through your bash terminal, it gets through readline library. so if the attacker replaces readline with a backdoor-ed version, bash would have no idea and you’ll have the easiest keylogger in the world. So it’s a bit tricky to SSH into a compromised host and copy your “helper” scripts and tools, hence all of them might get leaked quite easily.
To combat this issue, I’ve built quite a few tools for Linux (both amd64 and arm7-arm64) with static linking, so the binary can be run directly w/o any need for a shared library. This (mostly) eliminates the risk of a malicious actor pwning one of your core libraries or even worse, backdoor it. I have both tcpdump and tcpshark in that toolkit :)
Use cases
You probably have your own copy of tcpdump to capture packets. Easy to use, powerful and portable. you’ll go open a screen or tmux session on your target, run a tcpdump in the background and detach and continue your IR, and when you’re done, you’ll bring that pcap file to your system later on for further analysis and as potential evidence. Side note, you can always directly run a tcpdump from a remote location, and have it live in your Wireshark, using something like this:
|
|
If you do capture packets locally (without the fancy SSH piping), I bet you open it at least once in Wireshark and go over the packets and their statistics before you give it to another tool to processed or maybe even indexed. If you do, you’ve probably seen that this is where the limitation of tcpdump and other packet capture tools will become apparent.
Let’s say you have DNS packets from localhost to localhost, and then from localhost to 8.8.8.8 with a suspicious TXT query. It’s easy to see it, and it’s easy to potentially categorize it, but one of the questions that you usually can’t answer very well (by just looking at the packet) is this: which process did this?
This questions becomes even more important if the data itself is encrypted. Because, the notion of whether an encrypted piece of data is sent with malicious intent or not, entirely depends on the context. That context usually starts with a “who did this” rather than “what got sent”.
Technical details
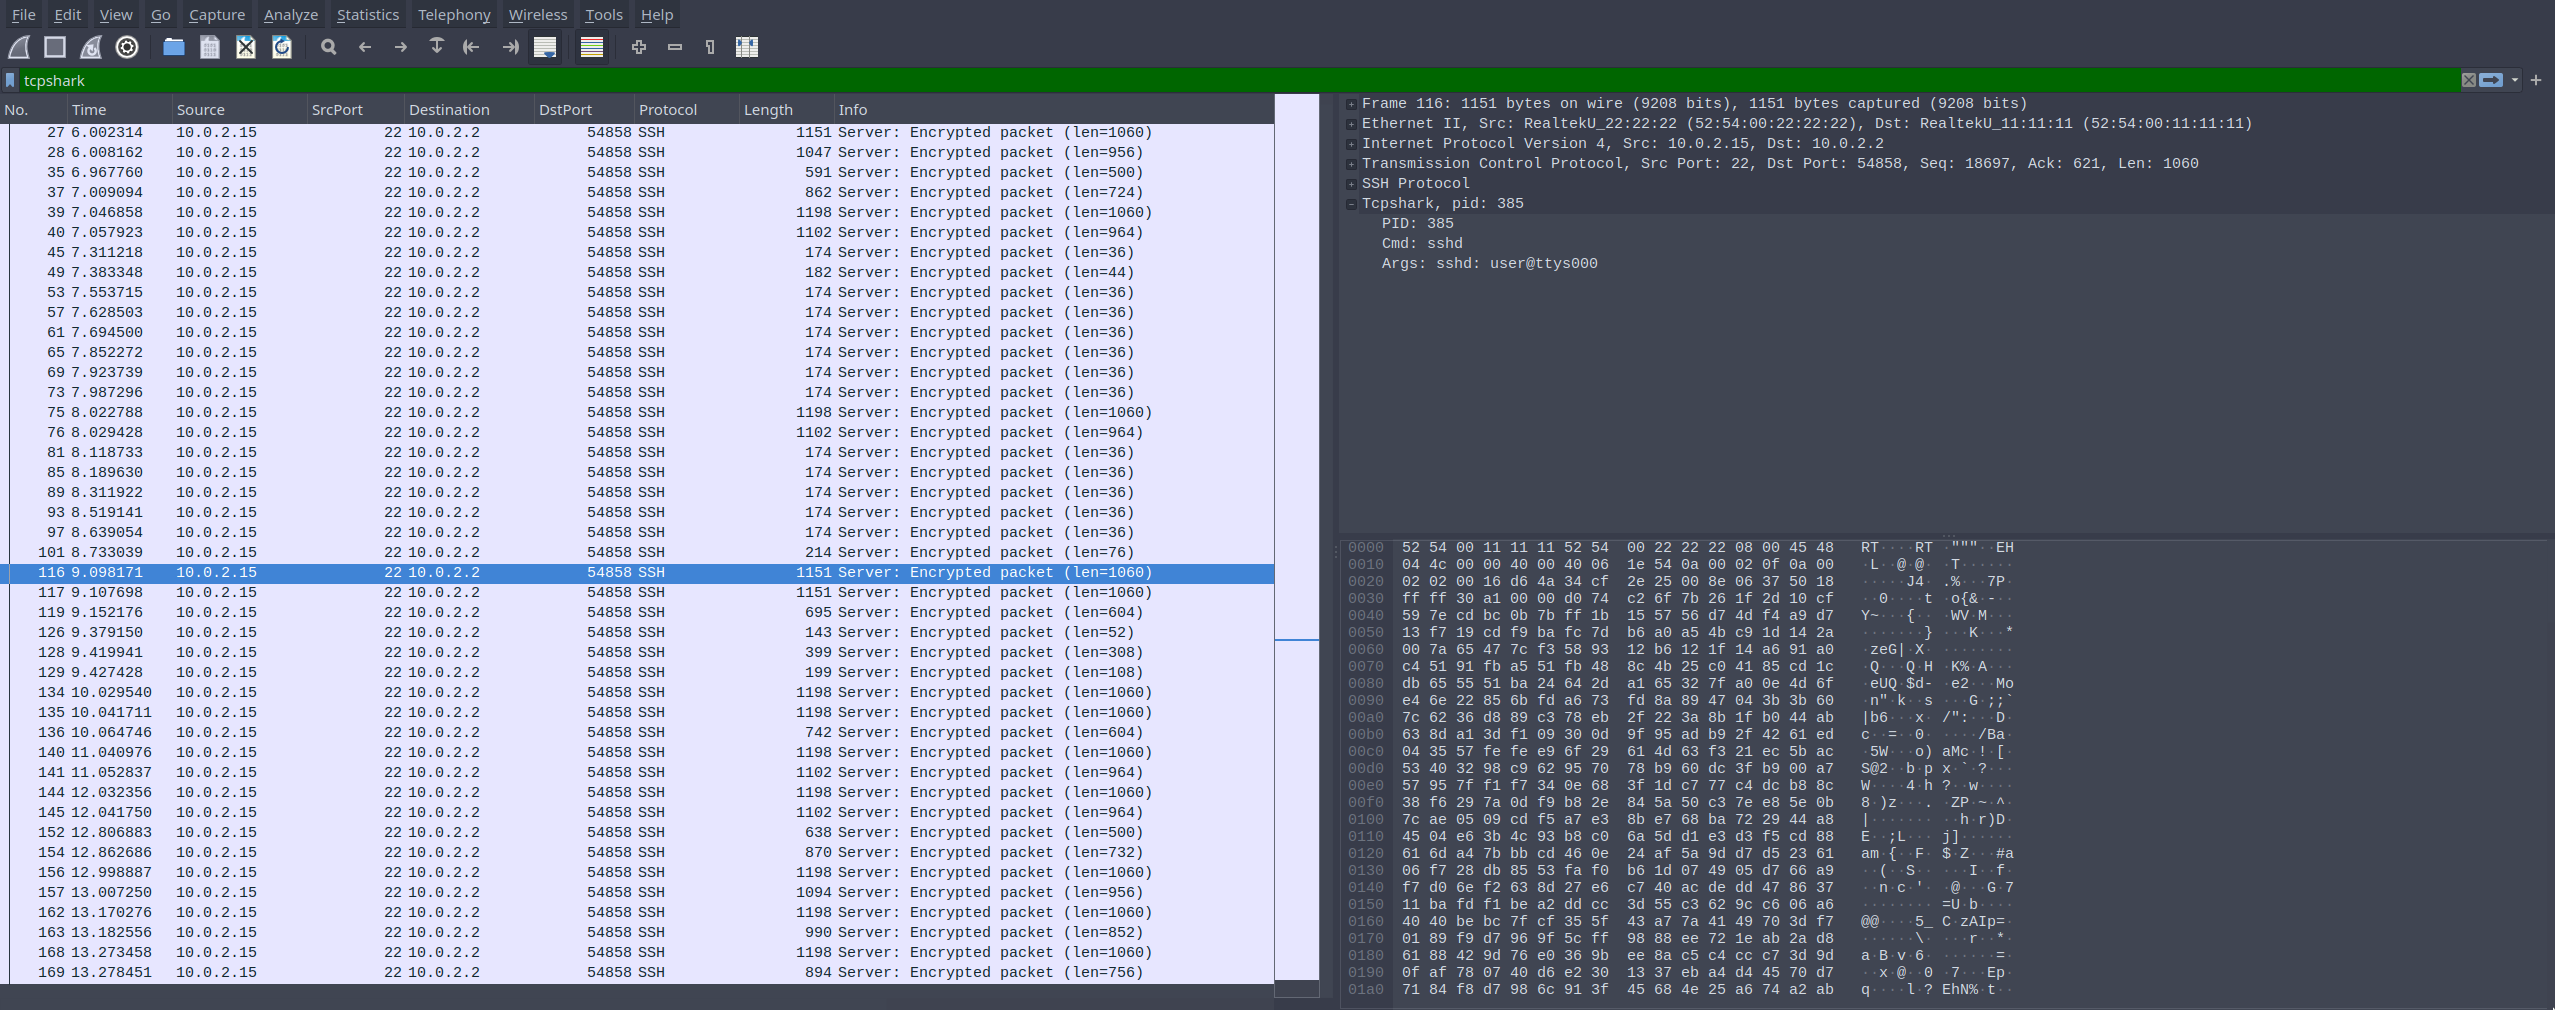
This is where tcpshark comes into play. It’s pretty simple really. tcpshark is a libpcap-based capture tool, just like tcpdump. But it has an extra nifty feature: while it’s capturing your packets as normal, it also captures your netstat output every second, and correlates the packets against it in near real-time, so each packet’s PID gets identified. tcpshark can then go and fetch more info on the PID, such as the command and the argv of it from the OS, and paint a full picture of what PID, with what context, is participating in the TCP or UDP connection. The collected “metadata” for the packet gets saved through a simple struct as an Ethernet trailer, that follows how packet dissectors work:

So each Ethernet packet, has a hex stream attached to the end of it as a standard trailer, which contains the PID, and optionally the command and the arguments (via the -v1 and -v2 tags). Now comes the interesting part: making that struct visible and searchble in Wireshark, and make it into a filter. That way, the defender can search what did any particular process send over the wire, and have the flexibility of playing with those parameters right inside Wireshark.
To do that, wireshark’s awesome custom dissector capability is used. it uses Lua scripting, and it has an excellent and thorough documentation. It was actually pretty straightforward to cobble something together, since our struct’s look and feel resembled every other network packet I’ve seen. Usually in packets, since the length of the content is not known, the length of any parameter is inside the packet, followed with the actual value. this saves a ton of space and makes it easy to write parsers that don’t overflow (easily).

Putting all the small pieces together, you can import the Lua file as a custom dissector in Wireshark (the how-to of doing this is in a YouTube video I included in the project README), and then open the pcapng file generated by tcpshark in Wireshark. If you’re a command-line buff, you can use the argument -X lua_script:tcpshark.lua so the dissector gets loaded each time, and you don’t have to copy and paste it to Wireshark’s plugin folders. Both ways work.
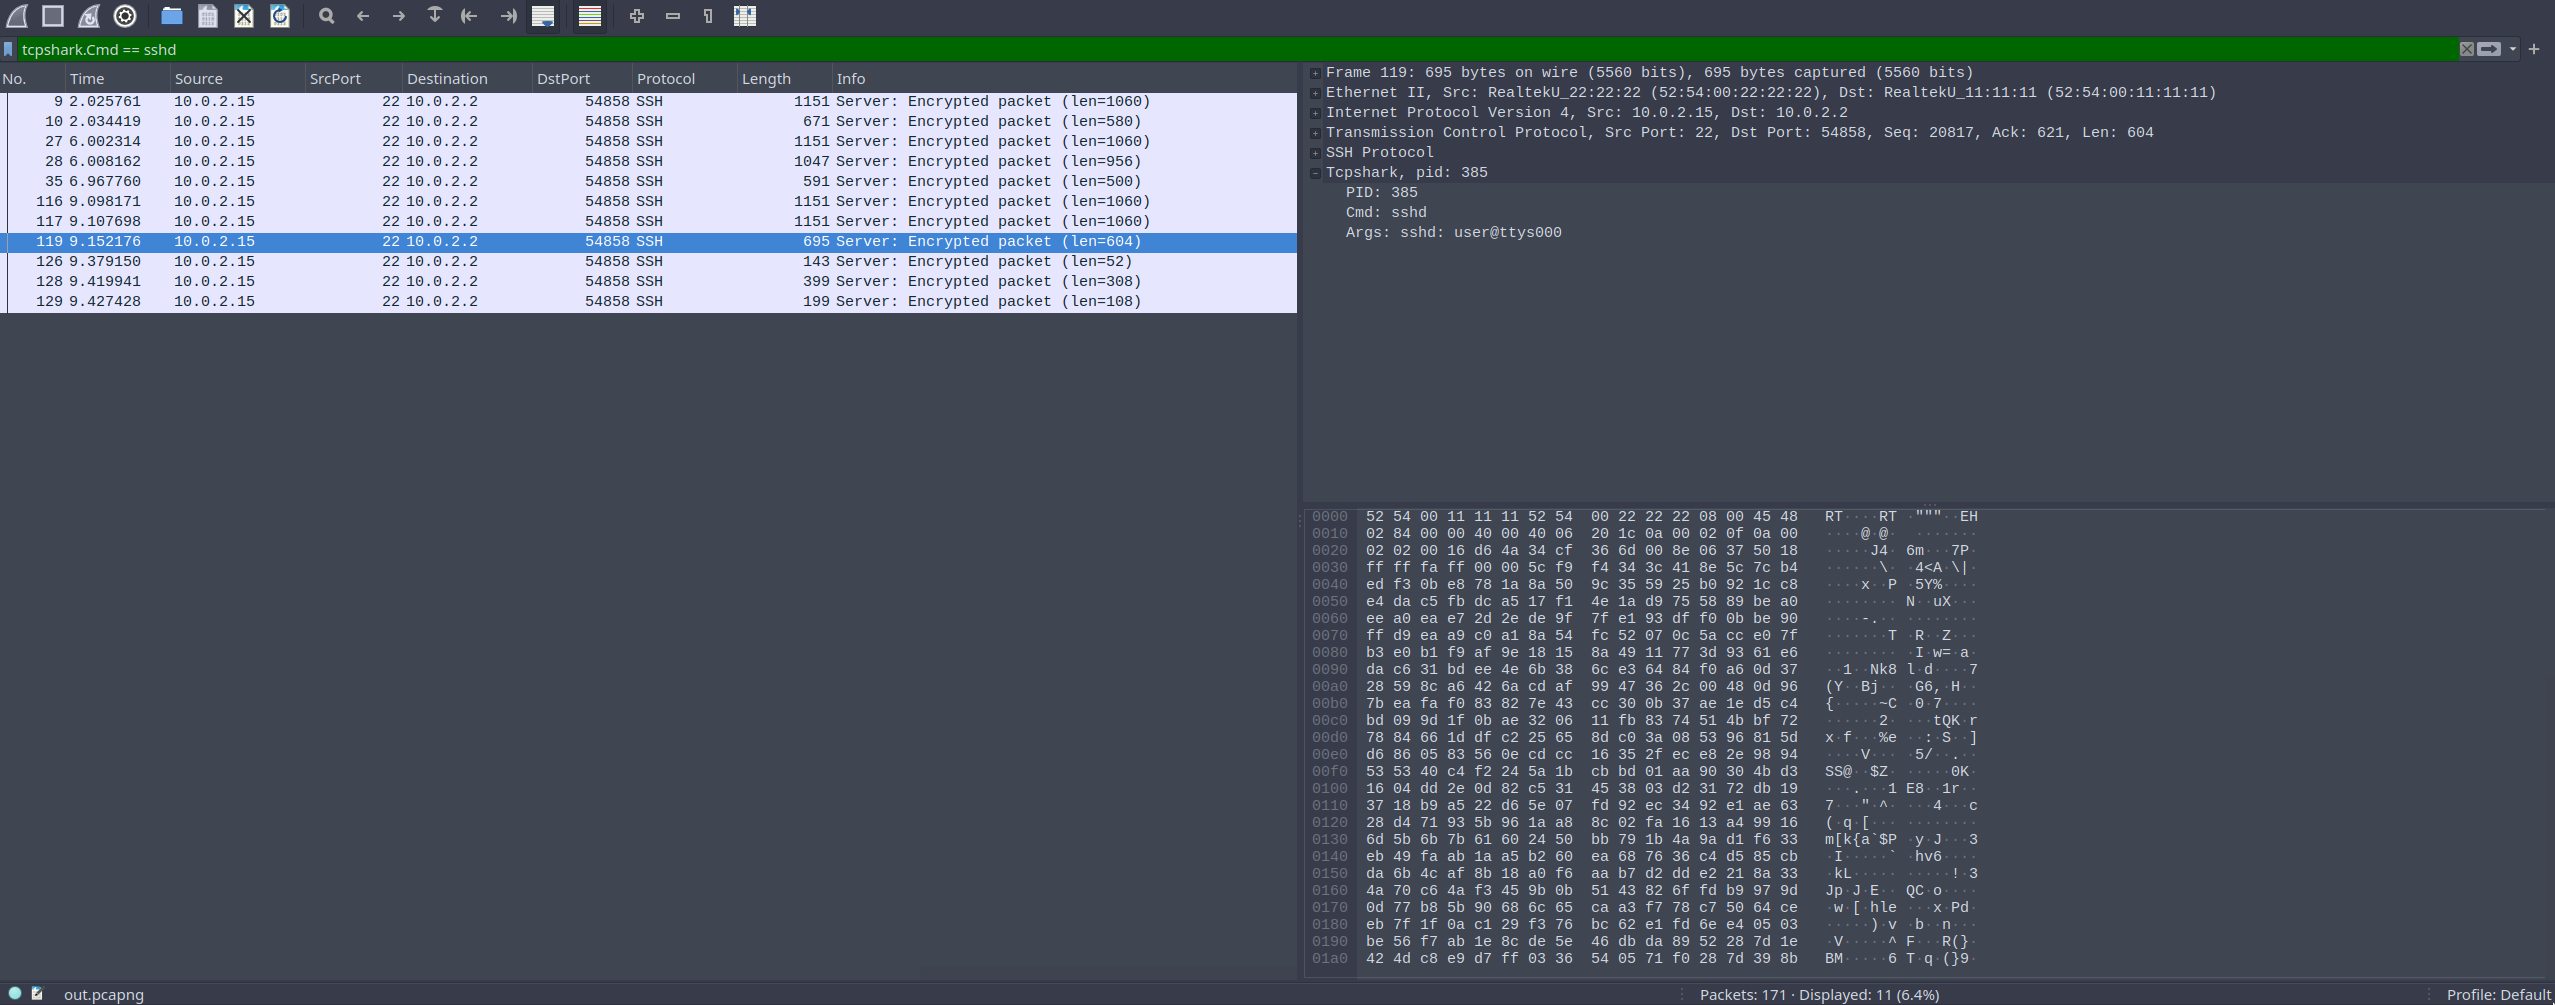
If everything works properly, you should be able to see tcpshark as a filter and also as a field in your capture:

You can also start filtering by PID, cmd and args using Wireshark’s builtin filtering system.

If you don’t load the dissector, the pcapng file is still perfectly usable by tcpdump and wireshark etc, it just won’t show you the extra info in a structured manner.
Closing thoughts
The project itself is still under development, especially ipv6 is not yet tested properly. It sits under my Github account here. Feel free to go check it out, and as always issues and PRs are welcome.